Home Services About Process Contact Us
Microsoft Power BI

Turn your data into
decisions that drive growth

Interactive dashboards, real-time analytics, and embedded reports โ€” built on your data, designed for your audience, deployed across your entire organisation.

Why Power BI?

Power BI is Microsoft's industry-leading analytics platform โ€” connecting to hundreds of data sources, transforming raw data into meaningful visuals, and putting real-time insights in the hands of every decision-maker across your business.

5M+
Organisations using Power BI
100+
Native data connectors
300%
Average ROI on analytics
Real-time
Live dashboard refresh
๐Ÿ“Š

Interactive visualisations

Charts, maps, KPIs, and matrix tables that update in real time โ€” with drill-through, slicers, and cross-filtering built in.

๐Ÿ”Œ

Connect any data source

Natively connect to SQL, Dataverse, Snowflake, SharePoint, Excel, Azure Data Lake, Salesforce, and hundreds more.

๐Ÿง 

AI-powered insights

Smart narratives, anomaly detection, Q&A natural language queries, and Copilot-generated summaries โ€” all built in.

๐Ÿ”’

Row-level security

Control exactly what each user sees with role-based data access โ€” regional managers see their data, not everyone else's.

๐Ÿ“ฑ

Mobile-ready reports

Dashboards are fully responsive across desktop, tablet, and mobile โ€” with a dedicated Power BI app for iOS and Android.

๐Ÿ”„

Scheduled & live refresh

Keep reports up to date automatically โ€” from hourly scheduled refreshes to DirectQuery live connections for real-time data.

Power BI Dashboards
๐Ÿ“ˆ
Interactive DashboardsReal-time ยท Drill-through ยท Shareable

Dashboards & Reports (Interactive Analytics)

We design and build Power BI dashboards tailored to your role, your audience, and your KPIs. From executive summary views to granular operational reports โ€” every visual is purposeful, fast, and actionable.

Our designers work with your stakeholders to understand what decisions matter and build reports that surface the right insight at the right time.

  • Executive KPI dashboards with traffic-light indicators
  • Operational reports with drill-through to detail
  • Cross-filtering and interactive slicers
  • Custom branded themes matching your identity
  • Paginated reports for pixel-perfect PDF exports
  • Shared workspaces with controlled access
Get started โ†’
Power BI Data Modelling
๐Ÿ—„๏ธ
Data ModellingDAX ยท Power Query ยท Star Schema

Data Modelling (ETL & DAX)

Great reports start with a great data model. We build clean, performant data models using Power Query for transformation and DAX for calculated measures โ€” ensuring your reports are fast, accurate, and maintainable.

Whether you're connecting one system or blending a dozen sources, we design a model that scales with your data and your business.

  • Star schema data model design
  • Power Query M-code for ETL transformation
  • Advanced DAX measures and calculated columns
  • Incremental refresh for large datasets
  • Data quality rules and validation checks
  • Documentation and model governance
Get started โ†’
Power BI Embedded Analytics
๐ŸŒ
Embedded AnalyticsApps ยท Portals ยท Teams ยท Products

Embedded Analytics (In-App Reporting)

Bring Power BI reports directly into your custom applications, Power Apps, Power Pages portals, or Dynamics 365 forms. Users get insights without ever leaving the tool they're already working in.

We implement Power BI Embedded using service principal authentication, row-level security, and iframe or JavaScript API integration for seamless, branded experiences.

  • Reports embedded into Power Apps & Model-driven apps
  • Power Pages portal report embedding
  • Dynamics 365 dashboard form embedding
  • JavaScript API for custom interactivity
  • Token-based security for external customers
  • White-label analytics in your product
  • Embedded directly in Microsoft Teams tabs โ€” share live reports in channels and meetings
Get started โ†’
Power BI Dataverse D365
๐Ÿ”—
Dataverse & D365Snowflake ยท SQL ยท Azure Synapse

Dataverse & D365 (Data Platform Integration)

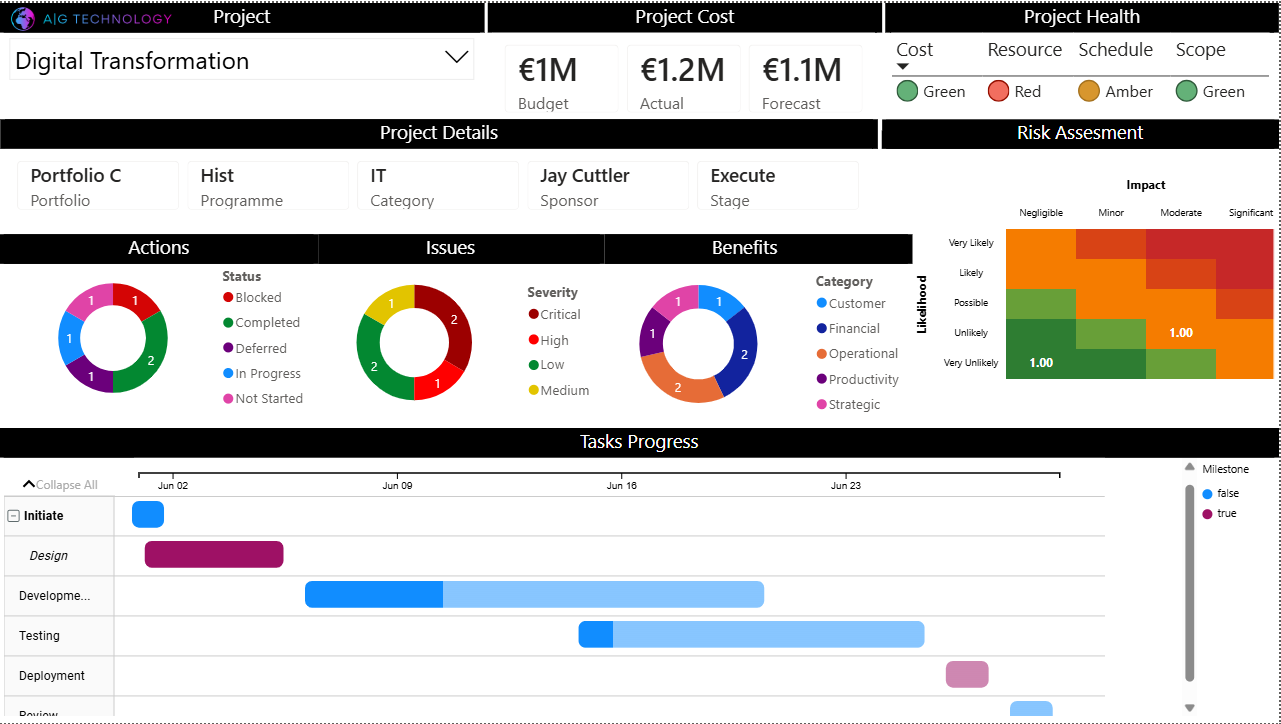
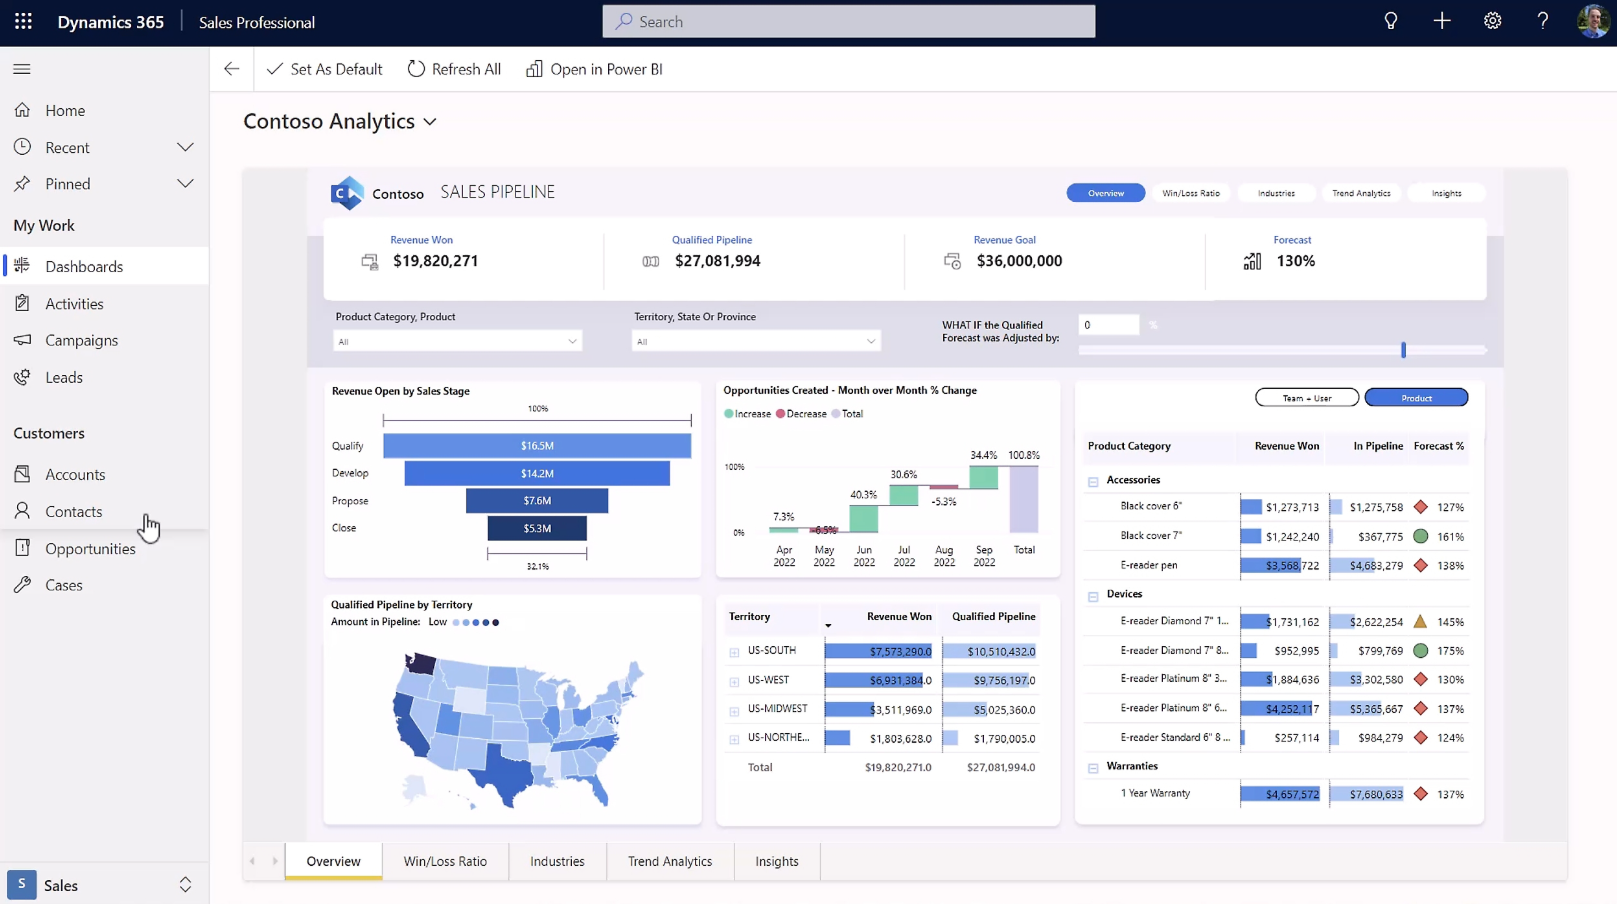
Unlock the full value of your Dynamics 365 and Dataverse data with dedicated Power BI reports. We connect directly to your CRM, sales pipeline, service cases, project data, and financial records โ€” transforming operational data into strategic insight.

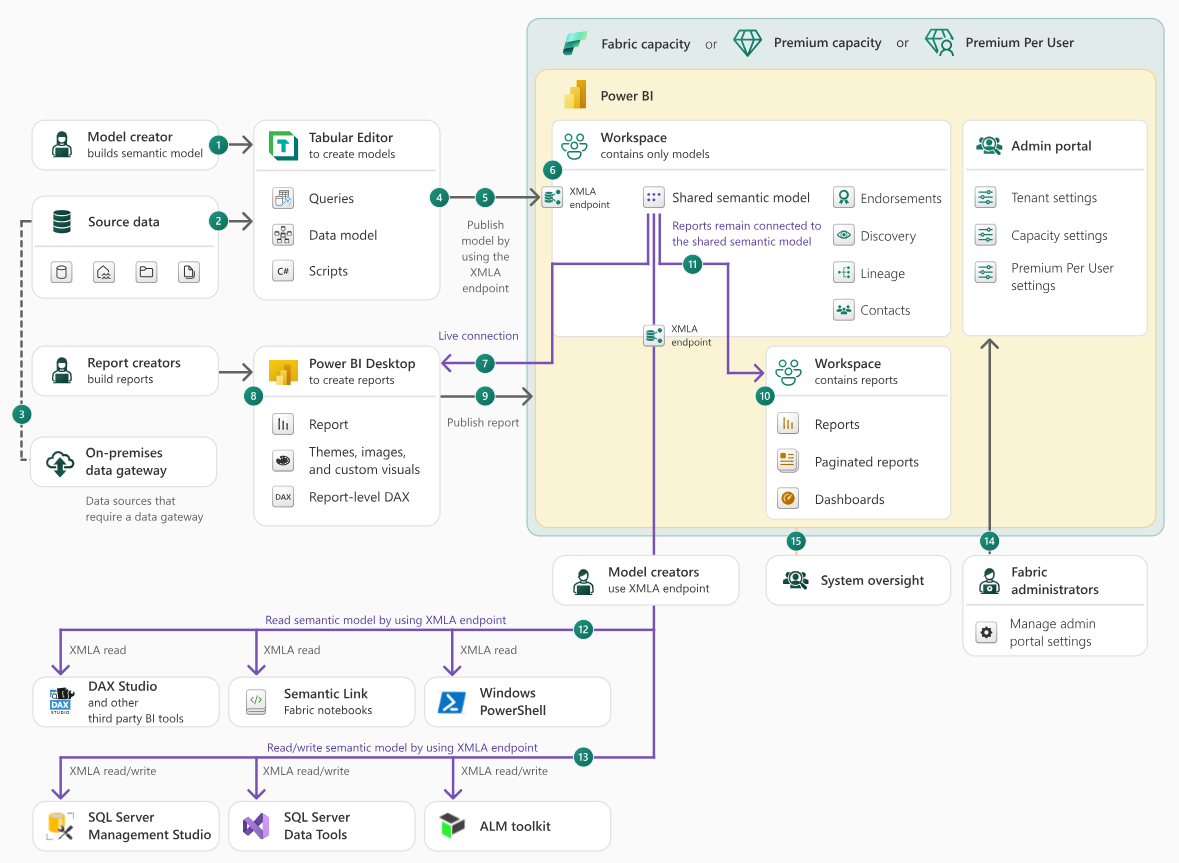
We also integrate with modern data platforms โ€” Azure Synapse, Data Lake, Snowflake, and SQL โ€” to create a unified analytics layer across your entire data estate.

  • Native Dataverse connector with DirectQuery
  • D365 Sales, CE, Finance & Operations reporting
  • Azure Synapse & Data Lake integration
  • Snowflake and SQL Server connectors
  • Multi-source blended data models
  • Azure Data Factory pipeline support
Get started โ†’

Related services

Power BI works best when paired with the rest of the Microsoft stack โ€” connect your data, automate your reporting, and act on insights instantly.

โ˜๏ธ

Azure

Azure Synapse and Data Lake provide the scalable data foundation that powers enterprise Power BI deployments.

โ†’
๐Ÿ“Š

Dynamics 365

Surface CRM and ERP insights directly in Power BI โ€” sales pipelines, case trends, and financial performance.

โ†’
โš™๏ธ

Power Automate

Trigger automated alerts and actions when Power BI detects anomalies or threshold breaches in your data.

โ†’

Ready to see your data clearly?

Our Power BI specialists will assess your data landscape and build dashboards your team will actually use every day.

Send us a message

Or book a call directly

Pick a time that works for you. 30 minutes with one of our Microsoft specialists.

📅 Book a 30-min call
Reply within 1 business day
🔒No spam, ever
🤝No obligation